Upgrade to High-Speed Internet for only ₱1499/month!
Enjoy up to 100 Mbps fiber broadband, perfect for browsing, streaming, and gaming.
Visit Suniway.ph to learn
| Highlights | ||||||||||
| (in million USD, except EPS and TCE) | Q4 2024 | Q4 2023 | 12M 2024 | 12M 2023 | YoY Growth (%) | |||||
| Net revenues | $41.7 | $39.4 | $167.5 | $110.2 | +52% | |||||
| Net income | $6.6 | $10.8 | $43.5 | $2.3 | Record Profitability | |||||
| Adjusted net income1 | $7.1 | $11.4 | $48.8 | $11.7 | ||||||
| EBITDA1 | $19.9 | $23.3 | $92.6 | $51.3 | +81% | |||||
| Adjusted EBITDA1 | $20.4 | $23.9 | $98.4 | $53.0 | ||||||
| Fleet TCE2 | $23,179 | $24,920 | $25,063 | $17,501 | +43% | |||||
| Earnings per share Basic | $0.32 | $0.55 | $2.12 | $0.12 | +1,667% | |||||
| Earnings per share Diluted | $0.32 | $0.55 | $2.11 | $0.12 | ||||||
| Adjusted earnings per share Basic1 | $0.34 | $0.58 | $2.39 | $0.63 | +279 | |||||
| Adjusted earnings per share Diluted1 | $0.34 | $0.58 | $2.38 | $0.63 | ||||||
Other Highlights and Developments:
- Record full year profitability of $43.5 million
- Fleet TCE outperformed the Baltic Capesize Index ("BCI”) by 27% in Q4 2024 and by 11% in FY 2024
- Quarterly cash dividend of $0.10 per share declared for Q4 2024 & total cash dividends of $0.76 per share, or $15.6 million, declared for FY 2024
- Stock buybacks of $2.1 million, or approximately 1% of issued and outstanding shares in Q4 2024
- Delivery of two recently acquired Japanese vessels:
- M/V Meiship, a 2013-built Newcastlemax
- M/V Blueship, a 2011-built Capesize, through a 6-month bareboat with purchase obligation
- New $53.6 million sustainability-linked loan facility
_______________________________
Get the latest news
delivered to your inbox
Sign up for The Manila Times newsletters
By signing up with an email address, I acknowledge that I have read and agree to the Terms of Service and Privacy Policy.
1 Adjusted earnings per share, Adjusted Net Income, EBITDA and Adjusted EBITDA are non-GAAP measures. Please see the reconciliation below of Adjusted earnings per share, Adjusted Net Income, EBITDA and Adjusted EBITDA to net income, the most directly comparable U.S. GAAP measure.
2 Time Charter Equivalent ("TCE”) rate is a non-GAAP measure. Please see the reconciliation below of TCE rate to net revenues from vessels, the most directly comparable U.S. GAAP measure.
ATHENS, Greece, March 06, 2025 (GLOBE NEWSWIRE) -- Seanergy Maritime Holdings Corp. ("Seanergy” or the "Company”) (NASDAQ: SHIP), a leading pure-play Capesize shipping company, announced its financial results for the fourth quarter and twelve months ended December 31, 2024. Reflecting its strong commitment to shareholder returns, the Company also declared a quarterly cash dividend of $0.10 per common share for the fourth quarter of 2024, with total cash dividends for 2024 of $0.76 per share.
For the quarter ended December 31, 2024, the Company generated Net Revenues of $41.7 million, compared to $39.4 million in the fourth quarter of 2023, representing an increase of 6%. Adjusted EBITDA for the quarter was $20.4 million, compared to $23.9 million in the same period of 2023. Net Income and Adjusted Net Income for the quarter were $6.6 million and $7.1 million, respectively, compared to Net Income of $10.8 million and Adjusted Net Income of $11.4 million in the fourth quarter of 2023. The daily TCE rate of the fleet for the fourth quarter of 2024 was $23,179, compared to $24,920 in the same period of 2023.
For the twelve-month period ended December 31, 2024, the Company generated Net Revenues of $167.5 million, compared to $110.2 million in the same period of 2023, marking an increase of 52%. Adjusted EBITDA for the twelve months was $98.4 million, compared to $53.0 million for the same period of 2023. Net Income and Adjusted Net Income for the twelve months were $43.5 million and $48.8 million, respectively, compared to Net Income of $2.3 million and Adjusted Net Income of $11.7 million in the respective period of 2023. The daily TCE rate of the fleet for the twelve-month period of 2024 was $25,063, compared to $17,501 in the same period of 2023. The average daily OPEX was $6,976 compared to $6,879 in the respective period of 2023.
Cash and cash-equivalents and restricted cash, as of December 31, 2024, stood at $34.9 million. Shareholders' equity at the end of the fourth quarter was $262.2 million. Long-term debt (senior loans and other financial liabilities) net of deferred charges stood at $257.6 million, while the book value of the fleet, including an advance for a vessel acquisition, was $488.2 million.
Stamatis Tsantanis, the Company's Chairman & Chief Executive Officer, stated:
"We are pleased to announce another strong quarter for Seanergy, underscoring the benefits of our strategic focus on the Capesize segment. Our robust hedging strategy resulted in the Company significantly outperforming the broader Capesize market, even amid seasonal year-end softness. Our fleet-wide daily TCE of $23,179, exceeded the BCI average of $18,300 by 27%, resulting in net income of $6.6 million for the fourth quarter of 2024. This strong finish capped off a record-breaking year, during which we achieved net income of $43.5 million, with a full-year daily TCE of $25,063, which is 11% above the BCI average of $22,593.
"Our disciplined commercial strategy and efficient operations allowed us to generate substantially superior results compared to industry peers, validating our exclusive focus on Capesize vessels. Unlike smaller dry bulk segments-where orderbooks have increased substantially-the Capesize orderbook remains at historically low levels, positioning this segment for potential outperformance over the long term.
"Our estimate for Q1 2025 TCE is approximately $13,400 per day, which reflects seasonal Capesize market softness but remains 44% above the year-to-date BCI average of approximately $9,300 per day. Meanwhile, our fixed-rate charters at $22,100 per day continue to significantly outperform spot levels, and with rising forward freight agreements ("FFAs”), we anticipate a stronger market in the second half of 2025.
"In line with our stated growth strategy, we executed targeted fleet expansion while maintaining a healthy balance sheet and rewarding shareholders with strong capital returns. We declared total dividends of $0.76 per share for 2024, representing a robust annualized dividend yield of approximately 11%3. In addition, during the fourth quarter, we repurchased 226,826 shares at an average price of $9.44 per share, further enhancing shareholder value.
"Since the second quarter of 2024, we have committed to invest $138.0 million in four high-quality Capesize vessels, bringing our proforma fleet to 21 units, or 3.8 million dwt. This strategic expansion further strengthens our profitability and cash flow generation potential, allowing us to continue capitalizing on the strength of the Capesize market. Importantly, we closed the year with a loan-to-value ratio of approximately 45%, underscoring our financial sustainability and prudent capital management in a volatile macro environment.
"The Capesize market continued to outperform smaller dry bulk segments in 2024, driven by a favorable supply-demand balance. Fleet growth was limited to just 1.7%, while seaborne iron ore, bauxite, and coal shipments increased substantially. Brazilian iron ore exports surged annually by approximately 6%, and Guinea's bauxite exports grew by over 15%, reinforcing the trend of increasing ton-miles, which directly benefits Capesize companies like ours.
"Looking ahead to 2025, Capesize fleet growth is projected to slow further to 1.4%, setting the stage for an even tighter supply-demand balance. While the start of the year saw seasonal weakness, spot rates and FFAs have risen sharply in recent weeks, pointing to a strengthening market in the months ahead. Vessel values have remained firm, which is a sign of industry confidence in the Capesize sector's long-term fundamentals.
"We believe that the long-term outlook for Capesize demand is robust, driven by rising Atlantic Basin iron ore and bauxite exports, a historically low orderbook, and tightening environmental regulations that are expected to restrict Capesize supply further. A key catalyst is the long-anticipated Simandou iron ore project in Guinea, which is set to commence exports in 2025 and is expected to significantly boost ton-mile demand further. At the same time, global energy needs continue to surge, particularly in emerging economies, as technology-driven industries such as AI, data centers, and semiconductor manufacturing require significant base-load power. Despite the energy transition, coal remains essential to the global power mix, supporting sustained Capesize demand as Asia ramps up imports.
"As a pure-play Capesize company, Seanergy remains uniquely positioned to capitalize on these long-term market tailwinds and to deliver consistent, superior returns to shareholders.”
_______________________________
3 Based on the closing price of March 3, 2025.
Company Fleet:
| Vessel Name | Capacity (DWT) | Year
Built | Yard | Scrubber Fitted | Employment Type | FFA conversion option(1) | Minimum time charter ("T/C”) expiration | Maximum T/C expiration(2) | Charterer |
| Titanship | 207,855 | 2011 | NACKS | - | T/C Index Linked | No | 09/2026 | 03/2027 | Costamare |
| Meiship | 207,851 | 2013 | Imabari | - | T/C Index Linked | No | 02/2026 | 06/2026 | Costamare |
| Patriotship | 181,709 | 2010 | Imabari | Yes | T/C Index Linked | Yes | 10/2025 | 03/2026 | Glencore |
| Dukeship | 181,453 | 2010 | Sasebo | - | T/C Index Linked | Yes | 06/2025 | 09/2025 | NYK |
| Paroship | 181,415 | 2012 | Koyo -Imabari | Yes | T/C Index Linked | Yes | 08/2025 | 01/2026 | Oldendorff |
| Worldship | 181,415 | 2012 | Koyo - Imabari | Yes | T/C Index Linked | Yes | 10/2025 | 02/2026 | NYK |
| Kaizenship | 181,396 | 2012 | Koyo Dock | - | T/C Index Linked | Yes | 07/2025 | 10/2025 | MOL |
| Iconship | 181,392 | 2013 | Imabari | - | T/C Index Linked | Yes | 03/2026 | 06/2026 | Costamare |
| Hellasship | 181,325 | 2012 | Imabari | - | T/C Index Linked | Yes | 04/2026 | 07/2026 | NYK |
| Honorship | 180,242 | 2010 | Imabari | - | T/C Index Linked | Yes | 03/2025 | 07/2025 | NYK |
| Fellowship | 179,701 | 2010 | Daewoo | - | T/C Index Linked | Yes | 06/2026 | 11/2026 | Anglo American |
| Championship | 179,238 | 2011 | Sungdong SB | Yes | T/C Index Linked | Yes | 04/2025 | 11/2025 | Cargill |
| Partnership | 179,213 | 2012 | Hyundai | Yes | T/C Index Linked | Yes | 02/2026 | 05/2026 | NYK |
| Knightship | 178,978 | 2010 | Hyundai | Yes | T/C Index Linked | Yes | 11/2025 | 01/2026 | Glencore |
| Lordship | 178,838 | 2010 | Hyundai | Yes | T/C Index Linked | Yes | 01/2026 | 05/2026 | Costamare |
| Blueship | 178,459 | 2011 | Mitsui SB | - | - | - | - | - | - |
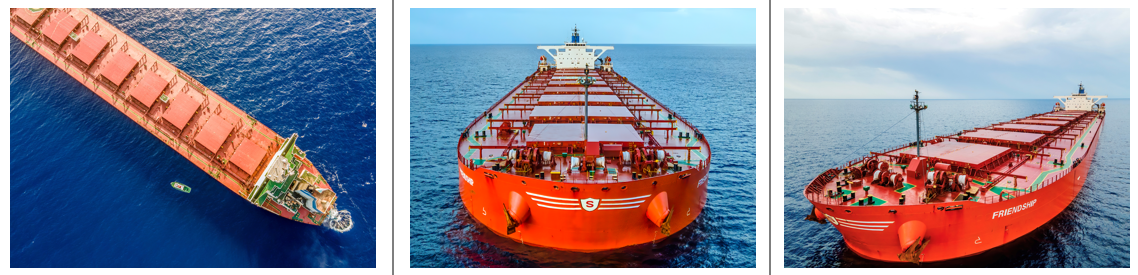
| Friendship | 176,952 | 2009 | Namura | - | T/C Index Linked | Yes | 12/2025 | 04/2026 | NYK |
| Flagship | 176,387 | 2013 | Mitsui | - | T/C Index Linked | Yes | 05/2026 | 07/2026 | Cargill |
|
This website uses cookies. By continuing to browse the website, you are agreeing to our use of cookies. Read More. |


